Wholesale Handbags Pricing Tiers: What 500 vs 2000 Pieces Really Costs
What does the jump from 500 to 2,000 pieces really save on wholesale handbags? In the case below it took about 11% off unit price — from a 500-piece index of 100 to nearer 89 at 2,000 — while quadrupling cash commitment, adding roughly nine weeks of stock cover and moving the freight maths across a container threshold. Those three effects pulled in different directions. Unit price falls fastest between 500 and 1,000 units and then flattens, because fixed lots and tooling are mostly absorbed within the first thousand pieces. Below: where the saving comes from, what it costs in cash and storage, and the calculation that decides which tier is actually right for your next buy.
- The Two-Tier Question One Buyer Asked
- What Moves Between Tiers, and What Does Not
- The Unit Price Index Across Four Tiers
- Where the Saving Actually Comes From
- The Cash and Storage Side of the Equation
- Freight Thresholds Change the Total
- The Break-Even Calculation
- Which Tier Should You Buy?
- Landed Cost per Unit at Each Tier
- Payment Terms as a Pricing Lever
- Markdown and Exit Arithmetic by Tier
What does the jump from 500 to 2,000 pieces really save on wholesale handbags? In the case below it took about 11% off unit price — from a 500-piece index of 100 to nearer 89 at 2,000 — while quadrupling cash commitment, adding roughly nine weeks of stock cover and moving the freight maths across a container threshold. Those three effects pulled in different directions. Unit price falls fastest between 500 and 1,000 units and then flattens, because fixed lots and tooling are mostly absorbed within the first thousand pieces. Below: where the saving comes from, what it costs in cash and storage, and the calculation that decides which tier is actually right for your next buy.
Tier reference points
The Two-Tier Question One Buyer Asked
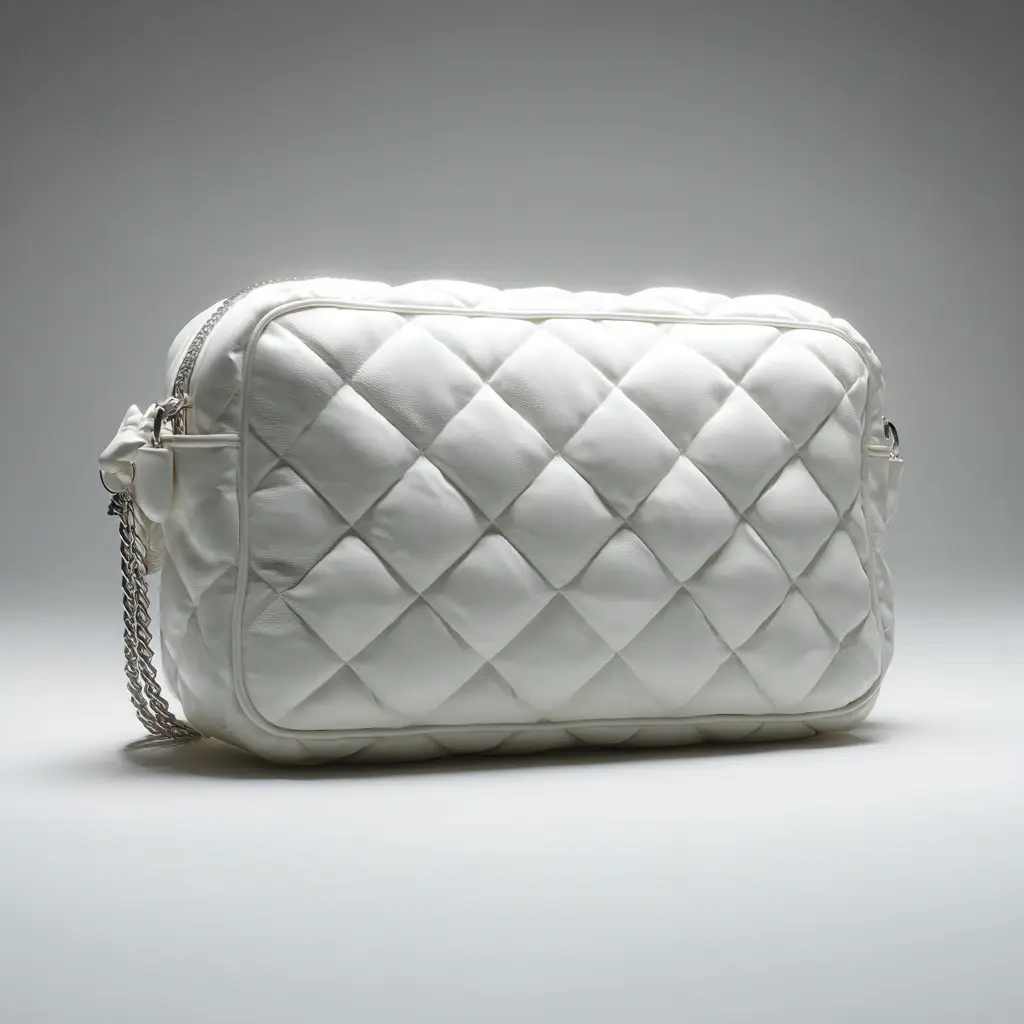
A boutique group with six doors had been buying 500 pcs of its bestselling crossbody twice a year, replenishing in a hurry each time it ran dry. Faced with a season-planning conversation, two tier quotes were requested for the identical style: one at 500 pcs and one at 2,000. The headline difference looked decisive, and the decision took several weeks longer than expected once the rest of the arithmetic was visible.
Three things emerged that the price comparison had concealed. The unit saving was real but smaller per unit than hoped. The larger buy crossed a freight threshold, which improved landed cost further and pulled in the other direction. And the cash committed quadrupled, adding roughly nine weeks of stock cover at the group's velocity and requiring storage that had not been budgeted.
The eventual answer was neither tier: 1,200 pcs split across two colourways, ordered rather than adding depth, plus a scheduled restock at the twelve-week cover point. That structure captured most of the unit saving while keeping the commitment inside what the group could finance. Drawing the general rule out of the specific case is what the rest of this page does.
What Moves Between Tiers, and What Does Not
Understanding tier behaviour starts with cost structure. Material runs 40-55% of unit price, trimming and hardware 15-25%, cutting and sewing labour 15-25%, packaging 3-8%, plus one-off tooling. Some of those components respond strongly to volume and others barely respond at all, and knowing which is which tells you where the real step sits.
Material responds least once the initial lot is covered, because buying more of the same leather or canvas from an existing dye lot buys mostly the same rate. Labour responds least of all, since every unit needs the same operations regardless of how many follow it. What responds strongly is everything fixed: lot minimums already met, tooling amortised further, and line changeover spread across more pieces.
Why Does the Curve Flatten After 1,000?
Because those fixed elements are largely absorbed once the first thousand units exist. Tooling amortised over 500 pcs might add a noticeable amount per unit, over 1,000 noticeably less, and beyond that barely registers. Hide nesting improves a little with larger cuts, and hardware breaks improve at their own thresholds, but neither behaves like the first step. This is why the MOQ ladder behaves as it does.
The Unit Price Index Across Four Tiers
Indexing the 500-piece price to 100 makes the shape obvious and avoids the false precision of publishing absolute figures that depend on material, construction and currency. These ranges describe a typical mid-weight leather or coated-fabric crossbody; a structured satchel with interlining and branded hardware responds slightly differently, mainly because more of its cost sits in operations.
| Tier | Index | What produced the step | Note |
|---|---|---|---|
| 500 pcs | 100 | Baseline: full branding package available | MOQ is per style / colourway |
| 1,000 pcs | 92-95 | Tooling amortised further; lot minimums met comfortably | Largest single improvement |
| 2,000 pcs | 86-90 | Better hide nesting; hardware breaks; one container | Cash commitment quadruples |
| 3,000 pcs | 83-87 | Mostly incremental | Diminishing return versus commitment |
Read the index as a shape rather than a promise. A construction dominated by material — a large unlined tote, for example — often improves by less than these ranges, because there is little fixed cost to spread. A construction with branded hardware shows larger steps at 1,000, because the casting and plating setup is the same whether pieces number five hundred or five thousand.
A concrete contrast helps. Two totes of identical footprint, one unlined in 12 oz canvas and one structured with interlining, a stiffener and a turn-lock, sit at very different operations counts — roughly 22-28 against 38-46. Because the structured version carries more labour and branded hardware, it shows a larger step between tiers, while the canvas version barely moves because almost nothing in it is fixed.
Where the Saving Actually Comes From
Not every cost inside a unit price behaves the way a tier table implies, and two in particular do not. A social-compliance audit such as BSCI is billed per audit rather than per piece, so the certificate costs the same whether it sits behind 500 units or 2,000, and the per-unit figure falls only because the denominator grew. A recycled-material claim under the Global Recycled Standard (GRS) behaves the same way: the transaction certificate is issued once, and its premium is amortised across whatever quantity eventually clears it.
Four mechanisms generate almost all of the improvement between tiers, and each can be asked about directly. Doing so turns the conversation from requesting a discount to restructuring the order, which is both more productive and more likely to succeed. Two of the four are entirely within your control at brief stage.
- Repeated setup. Line changeover is priced once per run, so spreading it across more units lowers the per-piece figure. The saving is real and finite.
- Tooling amortisation. Dies, label setups and moulds behave as fixed cost; the first thousand absorbs most of it.
- Material lot breaks. A larger buy can meet a higher minimum or improve hide nesting by a few percent, but rarely more.
- Hardware thresholds. Casting and plating costs fall per unit at certain counts, usually beyond several hundred pieces per finish.
Two levers sit with you rather than with pricing. Standard rather than custom hardware removes a mould cost entirely, and staying inside existing material lots rather than requesting a custom dye removes the largest single variable in the material line. Both are options at brief stage rather than arguments later, and both frequently deliver more than moving up a tier would.
The Cash and Storage Side of the Equation
This is the part the index conceals. Quadrupling quantity quadruples the cash outlay while removing only a tenth of the unit price, and every unit bought sits somewhere costing something until it sells. For a buyer financing through working capital rather than through a credit line built for inventory, that cost is paid monthly and invisibly.
In the group's case the 2,000-piece tier added roughly nine weeks of stock cover at its then-current velocity, meaning the last units bought would sit for something approaching two additional seasons. Storage, handling and insurance applied throughout, and the risk profile changed as well: a style whose taste moved would now write down at four times the exposure. None of that appears as a line in either quotation.
What Does Storage Actually Cost?
Put a number on it rather than treating it as overhead. Warehouse racking typically runs at a few cents per unit per month in most markets, and every additional week of cover multiplies that across the whole unsold quantity, alongside insurance and the labour of moving cartons twice. Ninety extra days on 1,500 units is not a rounding error; it is frequently larger than the entire unit-price saving the bigger tier produced.
Freight Thresholds Change the Total
Freight is the one place where a larger buy can improve landed cost beyond the unit index. Below roughly 12-15 cubic metres the shipment moves as less-than-container load at a per-unit cost several times the full-container figure; around 2,000-3,000 packed pieces typically reaches full container load economics with CIF or a comparable allocation, which is why the tier comparison should always be made landed rather than at origin.
Ask for landed figures at both tiers rather than applying freight yourself. The two cost lines behave differently: unit price improves slowly after 1,000 units, while freight per unit steps down sharply at the container threshold. Where the order sits just below that threshold, adding another style rather than more depth occasionally produces the better total, because breadth and depth both consume the same cube. Consolidating several styles into one shipment is the cleanest way to reach the threshold without deepening any single bet, and it also spreads branding and packaging setup across more SKUs at the same time.
The Break-Even Calculation
One calculation settles the tier question, and it takes about five minutes. Compute the extra cash the larger tier commits, then divide it by the per-unit saving across the whole larger order: that gives the number of units you must sell at the improved price to recover the additional commitment. Compare that figure with realistic velocity and the answer usually becomes clear immediately.
- Price both tiers landed, including freight, duty and handling rather than origin unit cost.
- Compute incremental cash: total commitment at the larger tier minus total at the smaller.
- Divide by unit saving across the larger order to get units needed to recover the difference.
- Compare with velocity: units sold at forecast rate within your planned cover window.
- Choose the tier that clears, remembering that the same arithmetic applies every season.
Applied to the group's case: the additional 1,500 units required roughly 1,100 of them to sell at the improved price before the larger tier became cheaper in total, which was well beyond what six doors would move inside a comfortable cover window. The 1,200-piece structure was chosen because it kept the commitment while capturing the part of the unit curve that actually matters, and a planned restock preserved flexibility.
What Changed Once the Tiers Were Priced Landed?
The group also stopped treating tiers as the only variable. Splitting the buy across two proven colourways rather than deepening one kept most of the middle-tier saving while halving exposure per colour, and scheduling the restock against a twelve-week cover point removed the February scramble that had previously forced air freight. Taken together those two changes were worth more than either tier difference, which is the recurring lesson across the whole wholesale side of this trade.
Which Tier Should You Buy?
Three answers cover most buyers, and none of them is simply the largest tier available. The deciding variable is not how much you can buy but how fast you can sell it, which is why the same style justifies different tiers for different businesses. Whichever you choose, buy it with both a cover target and an exit rule rather than hoping the season resolves itself. Treat the result as a standing rule rather than a one-off judgement, because the same five-minute calculation applies unchanged every season.
Whichever tier you land on, agree the cover target and the markdown rule in the same conversation, since tier choice and exit planning are the same decision seen from two ends. Buyers who treat them separately tend to discover that the cheaper tier was only cheaper for units that sold at full price, which is precisely the planning discipline behind any bulk buy.
Buy 500-1,000
First season for a style, limited working capital, or velocity still being established. Captures most of the available unit saving with manageable exposure.
Buy 1,000-2,000
Proven style with stable velocity, or filling a container deliberately across colours. Where the fade of unit price still justifies commitment.
Buy 3,000 plus
Only where sell-through has been demonstrated across multiple seasons and storage is genuinely cheap. Diminishing return beyond this point.
Whatever the quantity, whether you are buying existing stock or planning your own run, ask for prices at three quantities rather than one. The shape of that curve tells you more about where the economics sit than any single figure, and it costs one line in your enquiry. Request tier prices at 500, 1,000 and 2,000 pcs in the same email and compare landed rather than unit figures.
Landed Cost per Unit at Each Tier
The unit price index is quoted at origin and the decision is made at destination, and the two are not the same number. Freight per unit steps down sharply at the container threshold while unit price barely moves after 1,000 pieces, so the tier that wins on the index is not always the tier that wins landed. Ask for both columns in the same email and the comparison becomes straightforward.
| Tier | FOB index | Freight and duty per unit | Landed index |
|---|---|---|---|
| 500 pcs | 100 | USD 2.60-3.60 | 100 |
| 1,000 pcs | 92-95 | USD 2.10-2.90 | 93-96 |
| 2,000 pcs | 86-90 | USD 0.90-1.40 | 82-87 |
| 3,000 pcs | 83-87 | USD 0.80-1.20 | 79-84 |
- Duty does not fall with volume. It is a percentage of value, so a larger buy pays more duty in total and the same per unit.
- Freight is the step, not the goods. Most of the landed improvement between 2,000 and 3,000 comes from the container rather than from the price list.
- Ask for landed at three quantities. One line in the enquiry produces the whole curve.
Payment Terms as a Pricing Lever
Two prices can differ by more than the unit index suggests once the terms are read. A deposit released earlier, a balance settled before shipment, or a price held across a season each has a value, and each is available without touching the specification. These are the levers that sit on the commercial page rather than the product page, and they are the ones most often left unasked.
| Lever | Typical value | What it commits | When to ask |
|---|---|---|---|
| Larger deposit, 50 rather than 30 per cent | 1-2 per cent | More cash earlier | At quotation, not after |
| Balance before shipment rather than against documents | 0.5-1 per cent | Cash before the inspection report | Only on a proven style |
| Annual volume stated rather than withheld | 2-4 per cent | Nothing binding | In the first email |
| Price held for 90-180 days | Removes re-quotation risk | A repeat inside the window | Before the deposit |
- A stated annual volume is free. It commits the buyer to nothing and it is the single exchange most likely to improve a first price.
- An earlier deposit is the cheapest lever. A 20-point shift on the deposit is worth about the same as moving from 500 to 1,000 pieces.
- Ask for the validity window in writing. A price quoted with no expiry is a price that can move before the second drop.
Markdown and Exit Arithmetic by Tier
Every tier decision is also an exit decision, because the units that do not sell at full price are the ones that decide whether the tier was right. Set the markdown point, the depth and the recovery in the same conversation as the quantity, and the tier comparison stops being theoretical. Three numbers are enough: weeks to markdown, depth, and what is left after it.
| Tier | Weeks to first markdown | Depth | Units left at 60 per cent sell-through | Recovery on the remainder |
|---|---|---|---|---|
| 500 pcs | 10-14 | 25 per cent | 200 | About 55 per cent of retail |
| 1,000 pcs | 12-16 | 30 per cent | 400 | About 50 per cent of retail |
| 2,000 pcs | 16-24 | 40 per cent | 800 | About 40 per cent of retail |
| 3,000 pcs | 20-30 | 50 per cent | 1,200 | About 30 per cent of retail |
- Markdown depth rises with the tier. A larger buy has to clear more units in the same window, and depth is what clears them.
- A 40 per cent markdown is not a 40 per cent loss. Freight, duty and handling are already sunk; what is lost is the contribution above them.
- Agree the exit before the buy. A tier chosen without a markdown rule is a bet that the season resolves itself.
See how your tier pricing actually behaves
Send the silhouette, material direction and your target retail price. A private label coordinator will return landed figures at 500, 1,000 and 2,000 pcs at MOQ 500 pcs per style / colourway, with sampling at 6-10 working days. Get a quote.
Frequently Asked Questions
How much cheaper is 2,000 pieces than 500?
Typically around 10-14% per unit for a mid-weight leather or coated-fabric style, moving from an index of 100 at 500 pcs to roughly 86-90 at 2,000. The improvement is real but smaller than most buyers expect, and it must be weighed against four times the cash commitment and considerably more storage.
Why does unit price flatten after 1,000 units?
Because the fixed elements — line changeover, tooling amortisation and lot minimums — are mostly absorbed within the first thousand pieces. Material and labour, which together account for the majority of unit cost, do not fall materially with volume once you are inside an existing dye lot. Recompute the figure at every tier, since commitment and saving move in opposite directions.
Which cost components respond most to volume?
Everything fixed: tooling amortisation, setup spread across units, hardware breaks and occasionally improved hide nesting. Responsiveness is lowest in labour, which stays constant per unit, and moderate in material, which only improves where a larger lot crosses buying thresholds. Keep the number beside your cover weeks, where it determines the reorder date rather than the hoped-for one.
Does freight change the comparison?
Yes, sometimes decisively. Per-unit cost steps down sharply once a shipment reaches roughly 12-15 cubic metres and full container load pricing applies, which typically happens around 2,000-3,000 packed pieces. Always ask both tiers to be quoted landed rather than at origin. Confirm the figure is quoted landed, because origin prices hide freight and duty entirely.
What is a reasonable stock cover target?
Roughly eight to twelve weeks for stock purchased from existing inventory, and twelve to sixteen weeks where replenishment involves production. In the case above, the larger tier added about nine weeks of cover, which was the decisive argument against it. Recompute the figure at every tier, since commitment and saving move in opposite directions.
How do I work out whether a bigger tier is worth it?
Divide the incremental cash commitment by the per-unit saving across the larger order to find how many extra units must sell at the improved price to recover the difference. Compare that figure with realistic velocity in your cover window, and the answer usually appears quickly. Keep the number beside your cover weeks, where it determines the reorder date rather than the hoped-for one.
Is 3,000 pieces ever justified?
Only where sell-through has been demonstrated over multiple seasons and storage is genuinely cheap. Beyond roughly 3,000 units the unit-price curve has largely flattened, so the commitment grows faster than the return, and the markdown exposure multiplied by quantity becomes the dominant risk. Confirm the figure is quoted landed, because origin prices hide freight and duty entirely.
Does the MOQ change across tiers?
No. MOQ remains 500 pcs per style / colourway, so a 2,000-piece order means either one colourway at 2,000 or several colourways each meeting 500. Reading the minimum correctly is what prevents tier plans from collapsing into unrealistic configurations. Recompute the figure at every tier, since commitment and saving move in opposite directions.
Should I add colourways or depth?
Depth usually, until a silhouette has proven itself across seasons. Every colourway is a separate demand guess and each carries lot economics, whereas concentrating depth in a proven colour produces better evidence and generally lower write-downs. Keep the number beside your cover weeks, where it determines the reorder date rather than the hoped-for one.
How long does production take at larger quantities?
Bulk runs 35-50 days regardless of tier, though very large orders sometimes need a longer slot rather than longer production. Sampling stays at 6-10 working days, extending to 12-15 for framed, woven or stacked constructions. Confirm the figure is quoted landed, because origin prices hide freight and duty entirely.
Can I get better tier pricing another way?
Sometimes, by restructuring rather than by volume: standard hardware instead of custom casting removes a mould cost, and staying within existing material lots avoids custom-dye minimums. Both options are available at brief stage and frequently beat moving up a tier. Recompute the figure at every tier, since commitment and saving move in opposite directions.
What should I ask for when comparing tiers?
Prices at three quantities — 500, 1,000 and 2,000 — quoted landed to your destination with the delivery term and port named. Add whether tooling is billed separately and whether any part of the saving depends on branded hardware volumes. Keep the number beside your cover weeks, where it determines the reorder date rather than the hoped-for one.
Does inspection cost scale with quantity?
Sample size does, since AQL 2.5 under ISO 2859-1 ties it to lot size: 50 units at 500 pcs, 80 at 501-1,200 and 125 at 1,201-3,200. Inspection days stay in the one-to-two day range, so per-unit inspection cost generally falls as quantity rises.
People Also Ask
Why not always buy the largest tier?
Because unit price flattens while commitment and risk keep rising. Beyond roughly 1,000 units the additional saving rarely compensates for extra cash, storage and markdown exposure unless velocity has already been demonstrated.
Is it cheaper to consolidate styles into one container?
Usually yes. Freight thresholds are volumetric rather than per style, so combining several shapes into one shipment often reaches better pricing without adding depth to any single design.
Do material-dominated styles improve less with volume?
Generally yes. Where most unit cost sits in hide or fabric, there is little fixed cost left to spread, which is why large unstructured totes show flatter tier curves than hardware-heavy constructions.
How often should tier pricing be reviewed?
Every season, because material rates, currency and freight all move. A structure that worked last year may no longer be the better choice even with identical volumes.
Sources and further reading
Every figure on this page is either our own programme data or attributed below. Open the originals before you write them into a specification.
- SATRA — technical services for leather, footwear and accessoriesSATRA Independent leather, hardware and accessories testing protocols.
- Incoterms rulesICC The rules that decide where cost, risk and insurance transfer.
- FashionUnited — fashion industry news and dataFashionUnited Industry news and company data for the fashion sector.